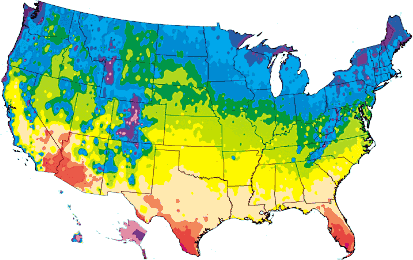
Heat Zone Map
 |
Zone |
Average Number of Days per year above 86°F |
|||
1 |
Below 1 |
||||
2 |
1 to 7 |
||||
3 |
8 to 14 |
||||
4 |
15 to 30 |
||||
5 |
31 to 45 |
||||
6 |
46 to 60 |
||||
7 |
61 to 90 |
||||
8 |
91 to 120 |
||||
9 |
121 to 150 |
||||
10 |
151 to 180 |
||||
11 |
180 to 210 |
||||
12 |
Above 210 |
||||
In 1997, Dr. H. Marc Cathey, President Emeritus of the American Horticultural Society (AHS), working with the Meteorological Evaluation Service Co. Inc., produced the AHS Plant Heat-Zone Map. The 12-zone map indicates the average number of days each year that a given region experiences "heat days" -- those days with temperatures over 86 degrees and the point at which plants experience damage to cellular proteins. The zones range from Zone 1 (with no heat days) to Zone 12 (210 or more heat days).
The data used to create the map were obtained from the archives of the National Climatic Data Center. From these archives, Meteorological Evaluation Services Co., Inc., in Amityville, New York compiled and analyzed National Weather Service (NWS) daily high temperatures recorded between 1974 and 1995. Within the contiguous 48 states, only NWS stations that recorded maximum daily temperatures for at least 12 years were included.
When used in conjunction with the Cold Hardiness Zone Map, consumers can now more accurately select plants that will thrive in their gardens throughout the year.
See also:
Cold Hardiness Zones: Map, Zip Code Lookup
Cooperative Extension Offices
Plant Finder

 (0)
(0)